Compensation Benchmarking: How to Benchmark Your Sales Comp Plan
Key takeaways
- Compensation benchmarking is a fit test, not a copy job. The goal is not to match the market's headline OTE. It is to confirm your plan is both attractive to hire against and affordable to pay out.
- Benchmark four levers together, never in isolation: OTE, pay mix, quota-to-OTE ratio, and commission rate. A generous OTE tied to a broken quota is a slow pay cut in disguise.
- Attainment is the missing benchmark. Only about 43% of cloud sales reps hit quota in 2025, per RepVue. An OTE benchmark means nothing if most of your team never reaches it.
- Segment before you compare. Role, ARR (annual recurring revenue) stage, deal size, and geography move every number. A $160K AE OTE at a seed company and a $50M ARR company are not the same offer.
- Rebenchmark on a cadence. OTEs have risen faster than quotas for a decade. A plan benchmarked two years ago is already off-market.
If you have ever opened your comp plan spreadsheet at the start of a new fiscal year and quietly wondered whether the numbers still hold up, this guide is for you. Benchmarking is how you answer that question with data instead of a gut feeling.
Here is the trap almost everyone falls into. You pull a market OTE, see that yours is roughly in line, and call the plan competitive. But competitive pay sitting on top of an unrealistic quota is not a good plan. It is an expensive one that reps leave anyway. The teams that get this right benchmark the whole system, not a single number.
Benchmarking is not about matching the market's pay. It is about confirming your plan is one your reps can actually hit and your Finance team can actually afford.
That is the lens we will use throughout. Whether you are a RevOps (revenue operations) leader redesigning plans, a CFO forecasting commission spend, or a sales leader defending quotas to the board, the goal is the same: a comp plan that survives contact with real attainment, not just one that looks good in an offer letter.
What is sales compensation benchmarking?
Compensation benchmarking is the process of measuring your sales comp plan against reliable external data to answer three questions at once. Can you hire against this plan? Can your reps realistically earn what it promises? Can Finance forecast and afford what it pays out? A benchmark that answers only the first, competitiveness, and ignores the other two is not a benchmark. It is a recruiting brochure.
Most teams never get past that first question. They treat benchmarking as a salary-lookup: find the market OTE for the role, match it, move on. That framing is where comp plans quietly break.
Note the difference from salary benchmarking, which only asks what the market pays a role. Compensation benchmarking asks whether your whole pay-for-performance system holds up.
Why does benchmarking your sales comp plan matter now?
The reason benchmarking matters more in 2026 than it did five years ago is a single trend: pay went up while attainment fell.
Median SaaS Account Executive OTE reached $200K in The Bridge Group's 2026 AE Models, Motions and Metrics report, up from $190K in 2024 and $167K in 2022. Over that same window, on-target earnings rose at roughly 4.9% compounded annually while quotas grew at about 2.4%.
On paper, that looks like reps are winning. In practice, the opposite happened, because quotas kept climbing off an already-high base.
Look at attainment. The Bridge Group found AE quota attainment fell to 48% in 2026, down from 51% in 2024. RepVue's Cloud Sales Index, drawn from roughly 47,000 quota-carrying professionals, put average attainment at 42.69% in Q2 2025 and 43.24% in Q3 2025. Read plainly: most reps are missing quota, and the market has been sitting there for years.
.webp)
This is the modern context that changes benchmarking from a nice-to-have into a control function. When most of the market cannot hit quota, copying the market's quota is copying its mistake. Benchmarking today is less about staying competitive on pay and more about not importing an unattainable plan that torches retention and forecasting accuracy at the same time.
There is a hiring cost on the other side of the same coin. Experienced reps compare OTE, pay mix, and quota across every offer they hold, so a plan that sits below the market median gets filtered out before the first interview. Replacing a ramped rep costs far more than paying at market, which is why benchmarking is a retention lever, not just a budgeting one.
TL;DR: Pay rose faster than quotas for a decade, yet attainment fell below the halfway mark. Benchmark to protect attainment, not just to match market OTE.
What sales comp benchmarks actually matter?
Benchmarking one number in isolation is how plans go wrong. You need the full set, because the levers interact. Here are the benchmarks that decide whether a plan works, with the primary sources behind them.
ACV here means annual contract value. Notice how these move together. A 4.6x quota-to-OTE ratio on a $200K OTE implies roughly $920K in quota, in line with The Bridge Group's reported $960K median. Change one lever and you have to re-check the others.
What is a good pay mix by role?
Pay mix is the split between guaranteed base salary and at-risk variable pay. It is the single most under-benchmarked lever, because most published data reports one blended AE number and stops there. The blended AE median is 53:47, per The Bridge Group. The role-level splits below are common industry conventions rather than a single-source benchmark, so treat them as starting points and confirm against your own attainment data. The logic is consequence-driven: the less control a role has over the close, the more base it should carry.
European teams typically run more conservative than this, closer to 60% to 70% base across roles. If you sell across regions, benchmark pay mix per region, not per company.
Rather than reverse-engineering these splits into a spreadsheet from scratch, you can start from role-specific plans built on these ratios: Visdum's free SaaS comp plan templates include ready structures for AEs, SDRs, AMs, and CSMs.
What is a healthy quota-to-OTE ratio?
Quota-to-OTE tells you how many dollars of bookings you expect for every dollar of on-target pay. It is the fairness diagnostic of the whole plan.
.webp)
The Bridge Group's 2026 median is 4.6x, up from 4.2x in 2024, and the direction of travel matters: the ratio is climbing, which is another way of saying quotas are outrunning pay.
In our implementation work at Visdum, that drift is usually silent. Quotas get nudged up 10% to 15% at annual planning while OTE stays flat, and no one recomputes the multiple until reps start missing in Q2.
Enterprise roles can justify a lower multiple because the deals are harder and longer. High-velocity transactional motions can support higher multiples because volume covers the gap. If you want to walk through the math and the edge cases, our deeper guide on the quota-to-OTE ratio breaks it down, and the OTE explainer covers the underlying formula.
What is the average sales rep quota attainment?
This is the benchmark most plans skip, and skipping it is the most expensive mistake in comp design. RepVue's Cloud Sales Index put average quota attainment at 42.69% in Q2 2025 and 43.24% in Q3 2025. The Bridge Group logged 48% AE attainment in 2026, down from 51% in 2024.
Here is the operator take. OTE describes earnings at 100% of quota, so an OTE benchmark is only honest if most of the team actually reaches quota.
When attainment sits near 43%, a $200K OTE is not a $200K plan. A rep on a 50:50 plan who lands at 43% of quota earns their full base plus only part of the variable, closer to $145K in realized cash than the $200K on the offer letter.
Benchmark your quota against attainment, not just against peer quota numbers. If fewer than half your reps can hit the number, the problem is not the reps. It is the math.
What commission rate is standard?
The median SaaS AE commission rate at 100% quota is 11.5% of ACV, with typical rates between 11% and 14%, per The Bridge Group's 2024 report (up from 10.3% in its 2022 edition).
What matters more than the headline rate is the shape: commission rate and deal size move inversely. Enterprise AEs earn a lower percentage on larger deals, while SMB AEs earn a higher percentage on smaller, more frequent ones.
That is intentional. A 5% rate on a $300K enterprise deal still pays well, while 5% on a $30K deal would not motivate anyone.
Above quota, accelerators take over. In common practice they pay 1.5x to 2x the standard rate on bookings above target, and most enterprise plans include some form of them. Accelerators are how you reward the overperformers you actually want to keep.
What market percentile should you pay at?
Benchmark data is a distribution, not a single number. Most reports publish the 25th, 50th, 75th, and 90th percentiles, and the median (50th) is only the starting point, not the answer.
Where you position is a decision, not a default. Paying at the 50th percentile means market par: competitive enough to stay in the conversation, but not a reason to choose you. Paying at the 75th percentile signals you intend to win and keep top talent, and it prices out weaker offers before the first interview.
Above-median OTE pays for itself in three cases: roles that are slow and expensive to fill, markets where reps hold multiple offers at once, and any seat where losing a ramped rep resets months of pipeline. In those cases the premium is cheaper than the churn.
The trap is paying at the 75th percentile on OTE while quota sits at the 90th. That is not a generous plan. It is an unreachable one dressed up as a generous one, which is exactly what benchmarking the full distribution is meant to catch.
How do you benchmark your sales comp plan?
Benchmarking is a repeatable process, not a one-time lookup. If you are designing a plan from scratch rather than tuning an existing one, pair this with our guide on how to build a SaaS sales compensation plan. Run these six steps in order.
1. Choose defensible sources:
Prioritize primary research and continuously updated datasets over job-posting screenshots. More on sources below.
2. Segment before you compare:
Break your plan out by role, ARR stage, deal size, and geography. Comparing a seed-stage enterprise AE to a public-company mid-market AE produces a number that misleads everyone.
3. Benchmark the four levers together:
Line up OTE, pay mix, quota-to-OTE, and commission rate side by side. Confirm they are internally consistent before you compare them outward.
4. Pressure-test against attainment:
Take your quota-to-OTE ratio and ask what percentage of reps can realistically hit it given your win rate and pipeline coverage. If the answer is below half, tighten the quota or raise the ramp support.
5. Model the payout cost:
Translate the benchmarked plan into total compensation expense at 60%, 100%, and 130% attainment. This is where Finance decides whether the plan is affordable, not just competitive.
6. Rebenchmark on a cadence:
Set an annual review, because OTE inflation moves the market underneath you. A plan benchmarked in 2024 is already drifting.
TL;DR: Pick trusted sources, segment your roles, benchmark all four levers together, stress-test them against real attainment, model the cost at multiple attainment levels, then repeat yearly.
To run step 5 without building a model from zero, Visdum's ROI calculator and tiered commission calculator let you see payout outcomes across attainment tiers in minutes.
Where should you get sales compensation benchmark data?
The quality of your benchmark is capped by the quality of your source. The most defensible approach triangulates across several rather than trusting any single one.
- The Bridge Group publishes primary biennial research on SaaS AE compensation, drawn from leaders at 150+ SaaS companies. Their 2026 AE Models, Motions and Metrics report is the latest, and the 2024 edition remains widely cited for pay mix.
- RepVue aggregates crowdsourced, continuously updated compensation and attainment data from tens of thousands of reps. Its Cloud Sales Index is the cleanest running read on real attainment.
- WorldatWork, Pavilion, and ICONIQ are worth consulting for cross-industry pay practices and stage-specific, senior-leader data. Confirm any figure against the source's own report before you rely on it.
One caution. Job-posting OTE is the least reliable benchmark you can use, because companies list the biggest number the plan could theoretically produce, not what reps earn. Treat posted OTE as a ceiling, then discount it by real attainment. As one revenue leader put it on Blind after renewals were pulled from his plan, his headline OTE had become effectively "unreachable." (Blind discussion)
What are the most common compensation benchmarking mistakes?
The failure modes are predictable. Each one comes from benchmarking a single number instead of the system. For a wider set of current numbers to check yourself against, see our roundup of sales commission statistics and industry benchmarks.
1. Benchmarking OTE alone: You match the market's pay and inherit the market's unattainable quota. The two travel together.
2. Ignoring attainment: A plan that looks competitive at 100% quota is a pay cut at 43% attainment. Always benchmark the number reps actually reach.
3. Using one blended number for every role: SDRs, AEs, AMs, and CSMs need different pay mixes. A single company-wide split guarantees at least one role is mispriced.
4. Copying US benchmarks into other regions: Regional pay mix and OTE norms differ enough to break a plan.
5. Benchmarking once, then leaving it: OTE inflation moves the market yearly. A stale benchmark is worse than none, because it feels safe.
6. Trusting job-posting OTE: It is a marketing number, not a payout number.
The industry itself is a live warning here. SaaStr's analysis of comp trends found that OTEs and quotas have both risen 10% to 15% year over year, which mechanically pushes more reps below quota, and referenced the view that a healthy plan should see roughly 80% of reps hit their number. (SaaStr) Benchmark toward that outcome, not toward the market's current attainment floor.
How do you turn benchmarks into a plan you can actually run?
Benchmarking produces numbers. Running a plan means those numbers have to survive month-end. That is the gap most teams underestimate.
Here is how it usually breaks. Finance builds the benchmark in a spreadsheet. RevOps turns it into plan rules. Sales promises reps an OTE. Then reality hits: accelerators stack in ways no one modeled, splits get disputed, a mid-year quota change breaks the accrual. The OTE on the offer letter drifts from what lands in the payout.
A benchmark tells you what the plan should be. It cannot make sure that is the plan reps actually get paid.
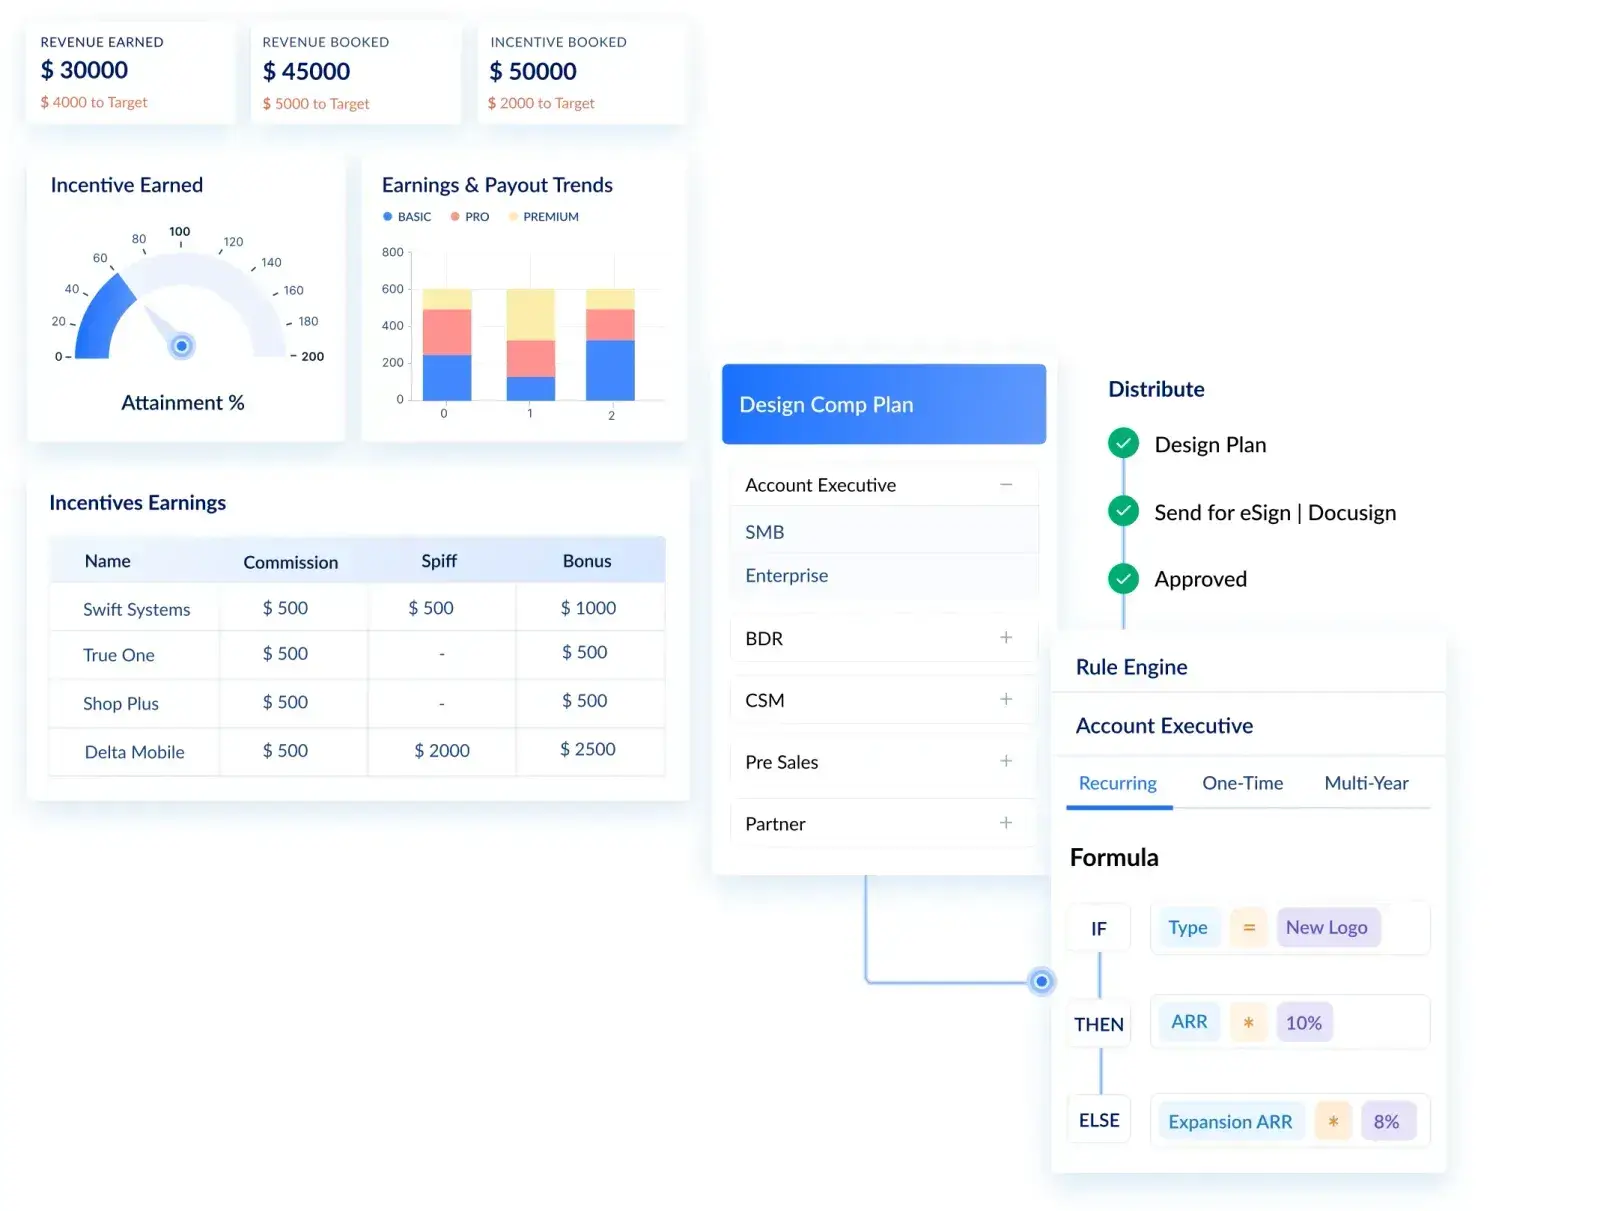
That gap, between the plan you designed and the plan you pay, is where compensation infrastructure earns its place. Visdum turns a benchmarked plan into a running system: it designs and explains plans, automates the commission math, shows reps their payouts in real time, and keeps everything audit-ready and ASC 606 compliant for Finance.
The benchmark sets the target. Visdum makes sure the plan you designed is the plan that gets paid, every cycle, with no spreadsheet in the loop.
Practical starting points, all free:
- Start from a role-specific plan in the comp plan template library.
- Track payouts against a benchmark with the free commission sheet template for teams up to 30 reps.
- Model earnings across attainment tiers with the tiered commission calculator.
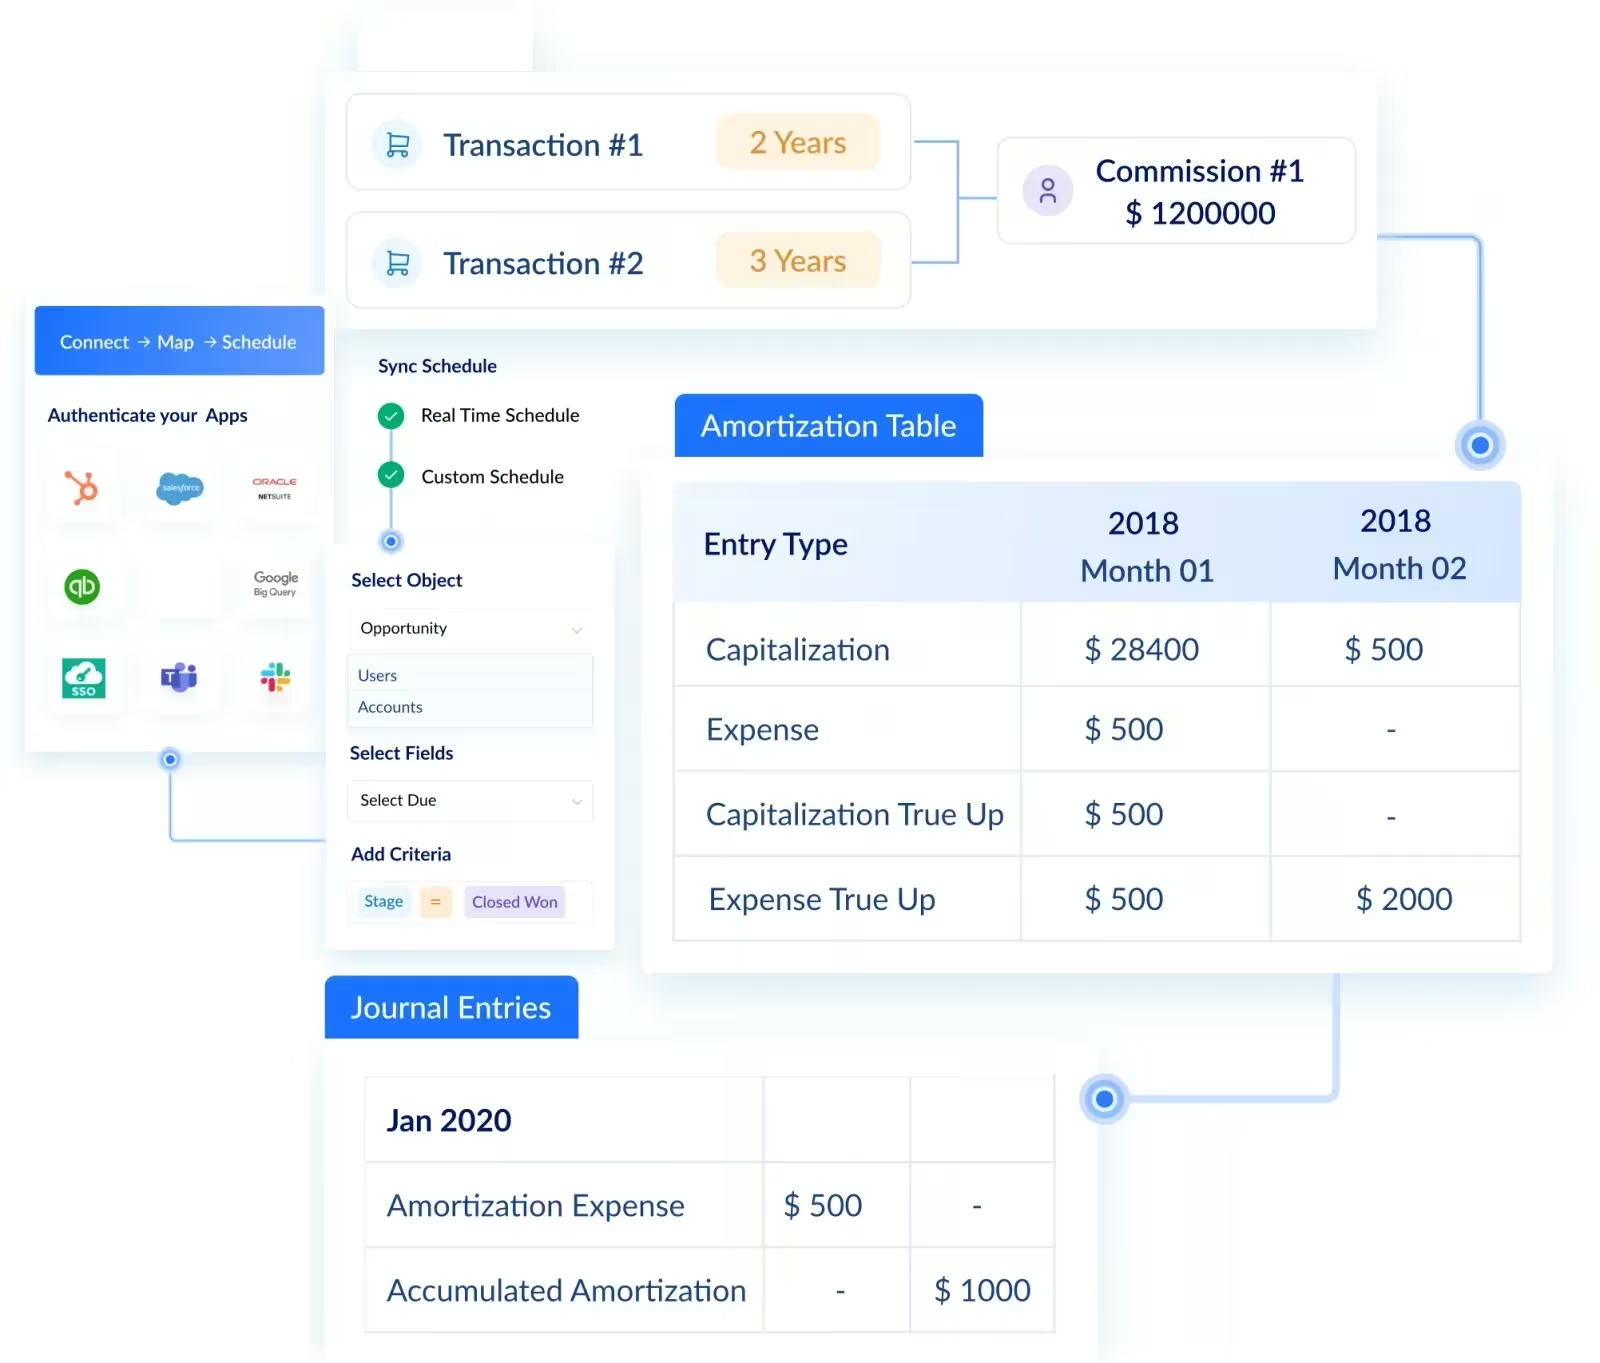
- Keep commission expense compliant with the ASC 606 amortization template.
- See how a benchmarked plan runs live in a self-guided product tour.
FAQs
What is a good quota-to-OTE ratio for SaaS?
Most B2B SaaS AE plans land between 4x and 5x, with The Bridge Group's 2026 median at 4.6x, up from 4.2x in 2024. Enterprise roles can run lower because deals are harder, and transactional roles can run higher. Anything above 6x to 7x usually strains motivation and retention.
How often should you benchmark a sales comp plan?
At least annually, and any time you materially change quota, territory, pricing, or your GTM motion. OTE has risen faster than quotas for over a decade, so a plan benchmarked two years ago is likely off-market already.
What is the average sales rep quota attainment?
Recent data clusters in the low-to-high 40s percent. RepVue's Cloud Sales Index reported about 43% average attainment across 2025, while The Bridge Group logged 48% AE attainment in 2026. Both confirm most reps miss quota, which is why attainment must be part of any benchmark.
Is OTE the same as guaranteed salary?
No. OTE is on-target earnings, meaning base plus variable pay at 100% quota. Only the base is guaranteed. Because average attainment sits near 43%, treat OTE as a target, not a promise, and benchmark it against real attainment.
What pay mix should an SDR have versus an AE?
SDRs typically run 65:35 to 70:30 base to variable, because they influence pipeline but do not own the close. AEs usually run 50:50, and enterprise AEs shift toward 55:45 to offset longer, more volatile sales cycles.
Should you use competitor job postings to benchmark OTE?
Only as a rough ceiling. Posted OTE is the largest legally quotable number, not the payout reps see. Discount it by real attainment and cross-check against primary research like The Bridge Group or RepVue.
How do you benchmark sales comp across different regions?
Benchmark pay mix and OTE per region, not company-wide. US SaaS closing roles cluster around 50:50 base to variable, while European teams typically run more conservative at 60% to 70% base. Local market rates, currency, and quota norms all shift, so a plan copied across borders will misprice at least one region.
What are the signs your sales comp plan is off-benchmark?
Watch for three red flags: quota jumped while OTE stayed flat, fewer than half your reps hit quota, or a quota-to-OTE ratio above 6x. Any one of these usually means the plan is off-market or unattainable, even when the headline OTE looks competitive.
About Visdum
Visdum is compensation infrastructure for high-growth and mid-market to enterprise revenue teams. It replaces spreadsheets and legacy commission tools with one platform for comp plan design, automated commission calculation, payout visibility, dispute management, compensation reporting, forecasting, and ASC 606 amortization. Finance gets accuracy and audit readiness, RevOps gets plans that are explainable and scalable, and Sales gets payouts they can trust.
If you have just benchmarked your plan, the next step is making sure it runs the way you designed it. Take a self-guided product tour or book a demo to see your own numbers modeled in Visdum.