CaptivateIQ Pricing Breakdown: Costs, Considerations & Real-World Insights
If you’re evaluating CaptivateIQ, one of the first questions you’ll likely have is: how much does it actually cost?
CaptivateIQ follows a custom, quote-based pricing model, which means final pricing depends on factors like team size, compensation complexity, integrations, and contract scope.
Since there are no publicly listed tiers, buyers often rely on third-party benchmarks to estimate costs for sales performance management solutions. In this guide, we break down:
In this guide, we break down:
- What CaptivateIQ officially says about pricing
- Third-party pricing benchmarks
- What actually drives total cost
- Trade-offs based on real user feedback
- And how it compares to alternatives like Visdum
Official CaptivateIQ Pricing: What the Vendor Says
If you visit CaptivateIQ’s pricing page, you won’t see:
- A per-user monthly price
- Tiered packages
- Starter or self-serve plans
Instead, CaptivateIQ requires you to book a demo and receive a custom quote based on:
- Team size
- Compensation complexity
- Integrations required
- Support level
This typically signals an enterprise sales model, where pricing is tailored, contracts are annual, and negotiation plays a significant role.
Estimated Captivate IQ Pricing from Third-Party Sources
Since CaptivateIQ doesn’t publicly list prices, we rely on third-party platforms and pricing reports, similar to what many B2B software agencies do when assessing SaaS pricing trends.
However, third-party platforms provide some benchmarks.
According to Vendr’s marketplace data, CaptivateIQ follows a per-seat annual pricing model. Negotiated deals have been reported around $660 per user per year (roughly $55 per user per month), depending on volume and contract terms. Larger contracts may receive discounts.
On Capterra, CaptivateIQ is listed at approximately $35 per user per month. This appears to be an unverified directory estimate rather than an official vendor price, but it offers a mid-market reference point.
What Drives the Total Cost of CaptivateIQ?
CaptivateIQ follows a per-seat, quote-based pricing model, meaning total cost depends on the number of users and overall contract scope.
1. Seat Count
Pricing scales based on total users, which may include admin users, RevOps/Finance teams, managers, and commissioned sales reps. As headcount increases, annual contract value rises accordingly.
2. Implementation & Onboarding
Enterprise commission platforms require structured onboarding, including compensation plan configuration and CRM integrations.
According to G2’s implementation insights, average time-to-go-live for CaptivateIQ is approximately three months, which can affect first-year ROI and internal resource planning.
3. Compensation & Integration Scope
More complex compensation structures or CRM configurations may extend implementation timelines. In enterprise SaaS agreements, implementation scope typically influences total contract size.
4. Add-Ons & Modules
Vendr marketplace data indicates that additional modules (such as Planning) and bundled products can increase overall contract value. Contract length and negotiated discounts also impact final pricing.
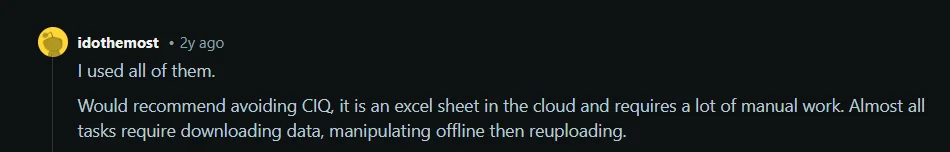
Captivate IQ Potential Trade-Offs to Consider
Looking at aggregated feedback on G2 (3,000+ reviews), several themes appear.
While many users praise flexibility and commission accuracy, others mention areas for improvement.
Steep Learning Curve
CaptivateIQ is powerful, but not always intuitive for new users.
Sales reps and managers may require training before fully understanding dashboards and reporting.

CaptivateIQ is powerful, but not always intuitive for new users.
Sales reps and managers may require training before fully understanding dashboards and reporting.
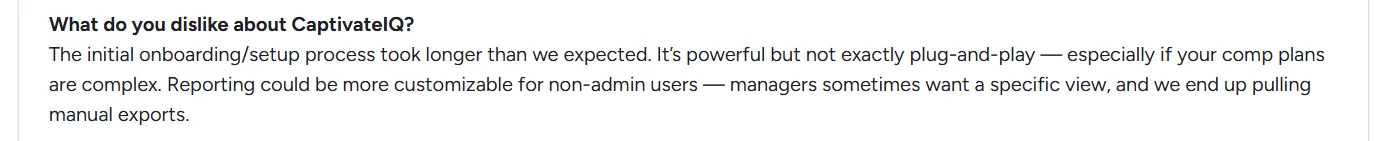
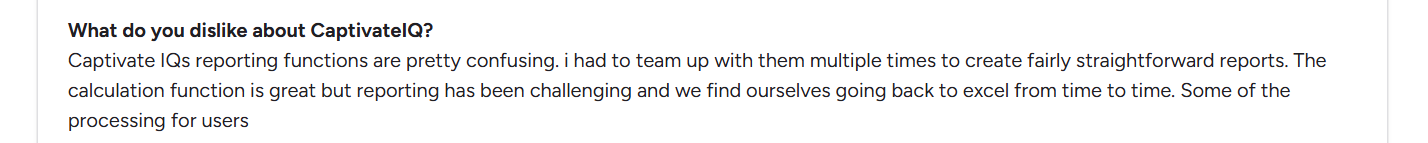
Reporting & Layout Limitations
Some users note that reporting layouts can feel restrictive, exports may require manual adjustments, and there is limited visibility into detailed payout logic, which can impact clarity for finance and Revops teams.
.webp)
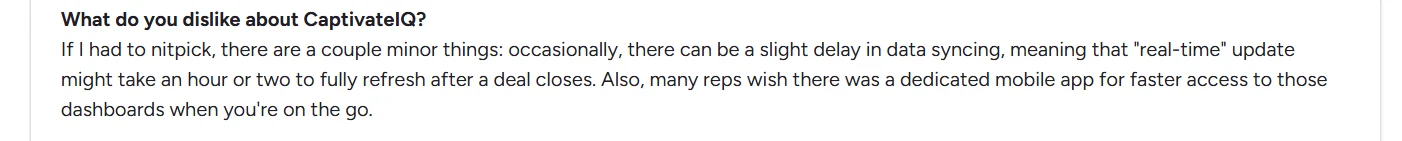
Performance & Loading Times
Reviews mention occasional slow loading times, especially when working with large datasets.
For revenue teams relying on real-time visibility, performance consistency is important.

Limited Mobile Functionality
Compared to newer tools focused on rep engagement, mobile experience is sometimes described as limited.
Is CaptivateIQ Worth the Investment?
CaptivateIQ is a strong enterprise-grade commission management platform, particularly for organizations that need structured governance and complex compensation modeling.
It works well for:
- Organizations comfortable with structured implementation timelines, especially when considering commission payouts.
- Teams with dedicated RevOps and admin resources
- Organizations comfortable with structured implementation timelines
However, based on user feedback and implementation data, there are some trade-offs to consider.
Some users mention a learning curve, particularly for sales reps and managers who need quick payout visibility.
Reporting layouts, while functional, can feel restrictive, especially for leaders who want deeper drill-down flexibility.
Mobile functionality is also described as limited compared to newer, rep-focused platforms.
Additionally, G2 implementation data suggests an average onboarding timeline of around three months, which can impact time-to-value.
When You Should Compare Alternatives
If your priority is:
- Granular payout transparency
- Finance-ready exports
- Faster onboarding
- Simpler rep engagement
- Mobile-responsive access for sales reps
- Highly customizable, role-based reporting
- Minimal technical setup with plug-and-play integrations
You may want to evaluate alternatives like Visdum before committing.
.webp)
CaptivateIQ vs Visdum: How Do They Compare?
Here’s how positioning differs:
While CaptivateIQ emphasizes enterprise flexibility, Visdum focuses on payout-level clarity, export readiness, and commission scenario modeling.
One RevOps leader made that comparison and moved off CaptivateIQ before landing on Visdum. Lynn Cappuccino, who ran the evaluation at ToolsGroup, put the internal verdict plainly:
"Our head controller said she's never using CaptivateIQ again. So I had to roll those to the side." — Lynn Cappuccino, Director of Revenue Operations, ToolsGroup
ToolsGroup runs commissions on Visdum today. Hear how Lynn describes the evaluation and what tipped it:
Why Teams Choose Visdum Over CaptivateIQ
While CaptivateIQ is positioned as an enterprise commission platform, many growing and enterprise teams are re-evaluating what truly drives value: speed, visibility, and usability.
Here’s why teams increasingly choose Visdum:
✅ Faster Time to Value
Unlike many compensation tools that require complex ETL and weeks of setup, Visdum’s integration connector is plug-and-play. Teams can move from implementation to operational use without heavy configuration layers.
Third-party data backs this up. On G2's Mid-Market Implementation Index, Visdum ranks #2 of 16 while CaptivateIQ sits at #10:
Source: G2, Summer 2026. Qobra leads this index; Visdum is second. Visdum also carries the Easiest Setup and Most Implementable badges for Mid-Market, with a reported implementation time of 2.85 on G2's scale, against the roughly three-month go-live the blog cites for CaptivateIQ.
✅ Better Payout Transparency
Visdum provides granular, payout-level visibility, allowing reps, managers, and finance teams to drill down into earnings without navigating multiple reporting layers.
Reps can clearly understand how each deal contributes to their earnings. Managers can analyze performance drivers. Finance teams gain clarity into calculations without relying on manual exports.
✅ Mobile-Responsive for Sales Reps
Visdum’s mobile-responsive view gives sales teams instant access to performance metrics, earnings, and payout progress in one place.
Reps can check commissions, understand earning components, compare performance across quarters, switch currencies, and download payout summaries, all in real time.
✅ Enterprise Dashboard
Visdum’s Enterprise Dashboard is designed to help leaders move from data to decisions quickly.
Metrics are logically grouped with a clear KPI-to-driver hierarchy, and performance can be sliced across any dimension, without rigid reports or data exports.
Role-based, customizable views ensure each team sees only what matters. It isBuilt for real-time action, not just visualization.
✅ Role-Based, Customizable Reporting
Visdum’s reports are structured by role and designed for clarity, allowing for the implementation of custom commission plans. Leaders can move from KPIs to detailed contributing factors without fragmented dashboards.
Reports can be structured based on:
- The metrics a role cares about
- The time frame they operate in for SOC compliance
- The specific plan or component being reviewed
- The required level of detail (summary vs. underlying data)
It’s built for in-the-moment decision-making. not just end-of-quarter analysis.
✅ Easier Adoption Across Teams
Visdum’s interface prioritizes simplicity and clarity. While onboarding is still required (as with any compensation platform), the learning curve is smoother and adoption across reps and finance teams is faster.
Conclusion
CaptivateIQ is built for structured, enterprise commission management, but its analytics and pricing depend heavily on team size, implementation scope, and add-ons.
If your priority is faster deployment, granular payout visibility, mobile access, and customizable reporting, it’s worth comparing alternatives like Visdum before making a decision.
Choose the platform that best supports how your team actually works, not just how compensation is configured.
.webp)
FAQs
How much does CaptivateIQ cost?
CaptivateIQ uses a custom, quote-based per-seat pricing model. Third-party benchmarks suggest negotiated pricing around $660 per user per year (~$55/month) according to Vendr, while Capterra lists an estimated ~$35 per user per month (unverified). Final cost depends on team size, complexity, and contract terms.
What factors influence CaptivateIQ pricing?
CaptivateIQ pricing is influenced by seat count (admins, reps, finance users), implementation scope, integration complexity, add-on modules, and contract length. Larger teams and more advanced compensation structures generally increase total cost.
How long does CaptivateIQ implementation take?
Implementation timelines vary based on company size and complexity. According to G2 insights, average time-to-go-live can extend to several months, depending on configuration and integration requirements.
Is CaptivateIQ suitable for mid-market companies?
CaptivateIQ is commonly positioned for enterprise teams with complex compensation structures. While mid-market companies can use it, total cost, implementation scope, and onboarding requirements should be carefully evaluated to ensure it aligns with budget and operational needs.
.avif)
.avif)

